pygmt.params.Axis
- class pygmt.params.Axis(annot=False, tick=False, grid=False, end_skip=False, label=None, alt_label=None, hlabel=None, alt_hlabel=None, prefix=None, unit=None, angle=None)[source]
Class for setting up one axis of a plot.
Examples
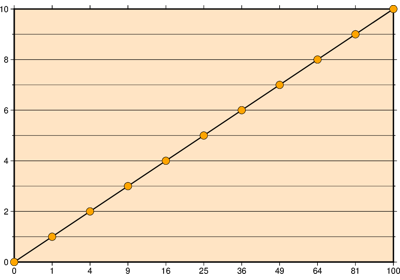
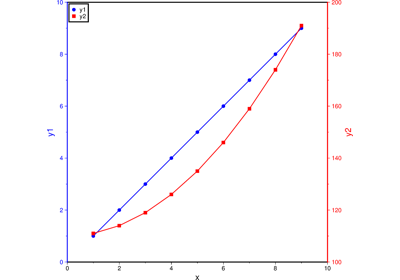
To specify the same attributes for x- and y-axes, with intervals of 4 for annotations, 2 for ticks, and 1 for gridlines:
>>> import pygmt
>>> fig = pygmt.Figure()
>>> fig.basemap(
...     region=[0, 10, 0, 20],
...     projection="X10c/10c",
...     frame=Axis(annot=4, tick=2, grid=1),
... )
>>> fig.show()
-
annot:
float|str|bool= False Specify the interval for annotations. It can be
Trueto let GMT decide the interval automatically; or a value to set a specific interval in the format of stride[±phase][unit], where, stride is the interval, phase is the offset to shift the annotations by that amount, and unit is one of the 18 supported unit codes related to time intervals.
-
end_skip:
Literal['lower','upper'] |bool= False Skip annotations that fall exactly at the ends of the axis. Set to
Trueto skip both ends, or use"lower"/"upper"to skip only the lower/upper end.
-
alt_label:
str|None= None Alternate label for the right or top axis [Default is the same as
label].
-
annot:
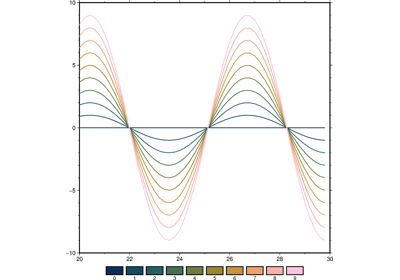
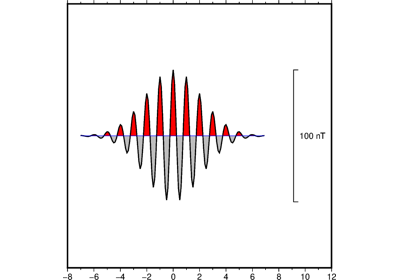
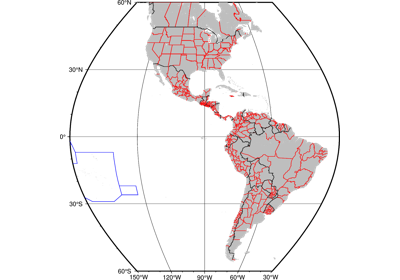
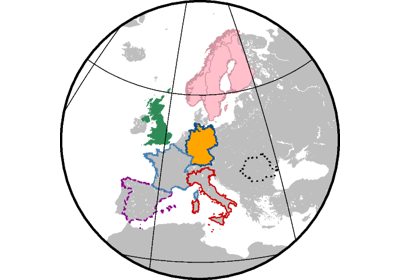
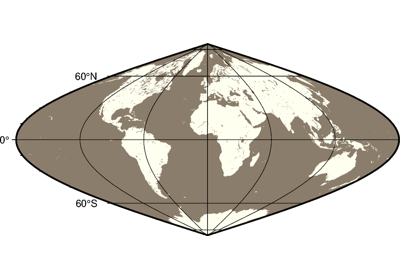
Examples using pygmt.params.Axis
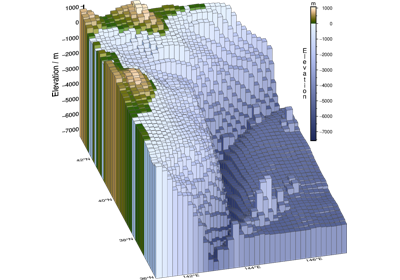


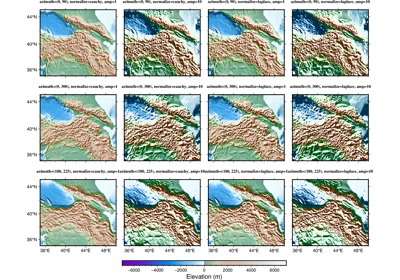
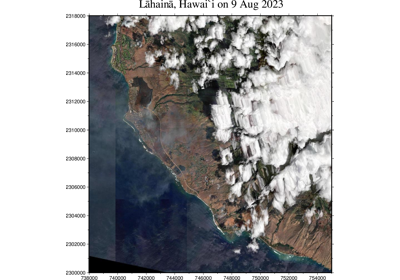
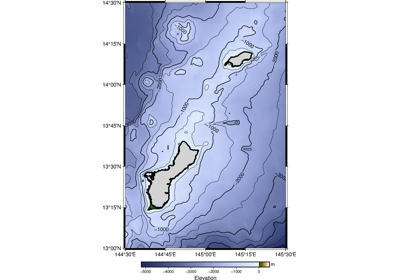
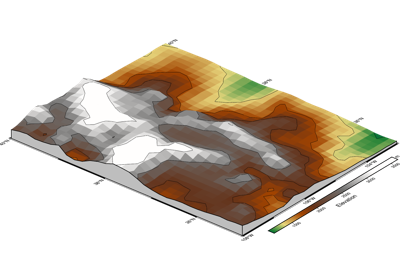
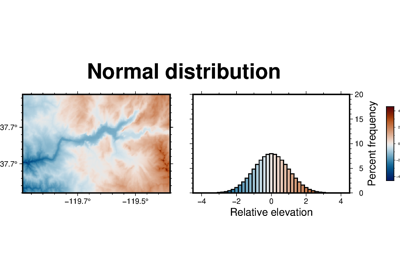
Calculating grid gradient with custom azimuth and normalization parameters